Evidence of Student Learning
OIRA provides an annual assessment report that provides an overview of student outcome achievements within the Core.
2023-2024 Core Assessment Report
2022-2023 Core Assessment Report
2021-2022 Core Assessment Report
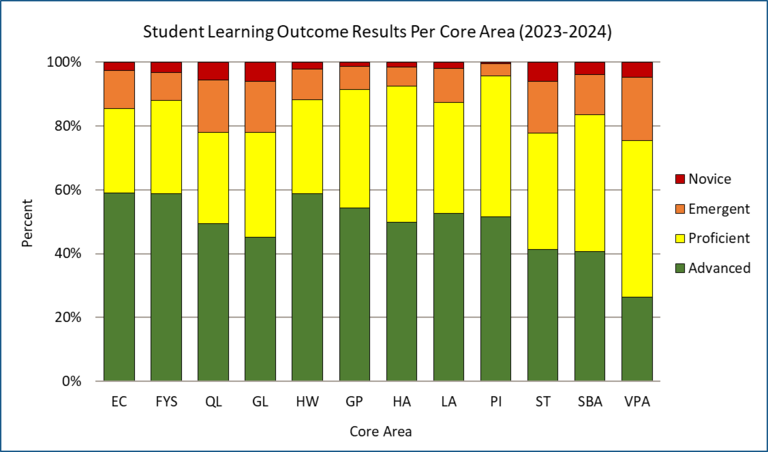
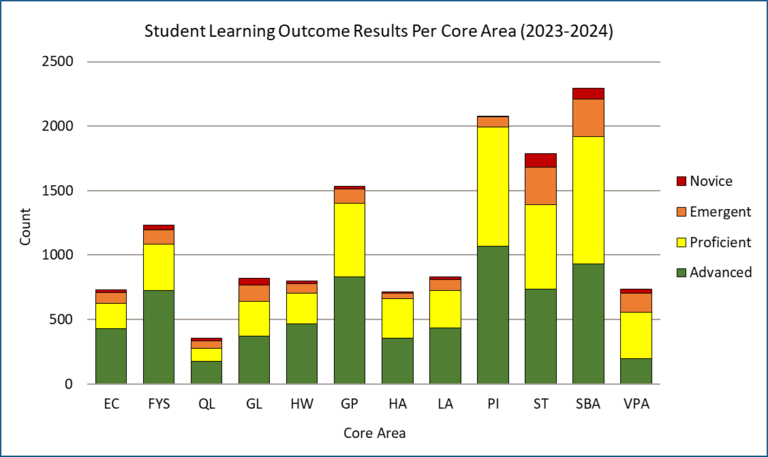
The following graphs show the 2023-2024 student learning outcome (SLO) results among all outcomes per Core area. SLO achievements naturally differ between Core areas due to variations in discipline difficulty, class size, student population, etc.
Are you ready to say Hello?
Choose a Pathway
Information will vary based on program level. Select a path to find the information you're looking for!